Chef Office Hour: Mining Automate’s Visibility data with Kibana
Mining Chef Automate’s Visibility data for fun and profit.
Automate + ELK
Automate utilizes the Elasticsearch, Logstash, Kibana stack for long term indexing and archiving of a myriad of interesting metadata.
You can get a sense of what sort of metadata is available via the default charts and graphs on Automate’s Workflow and Nodes tabs.
However, if you look under the hood, there is a whole lot more data available..
- Chef Server object modifications
- Roles
- Coookbooks
- Environments
- Databags
- Users
- Orgs
- etc ..
- Chef Client
- Node object
- Resources
- Total
- Changed
- Converge status
- Stack trace of any failures
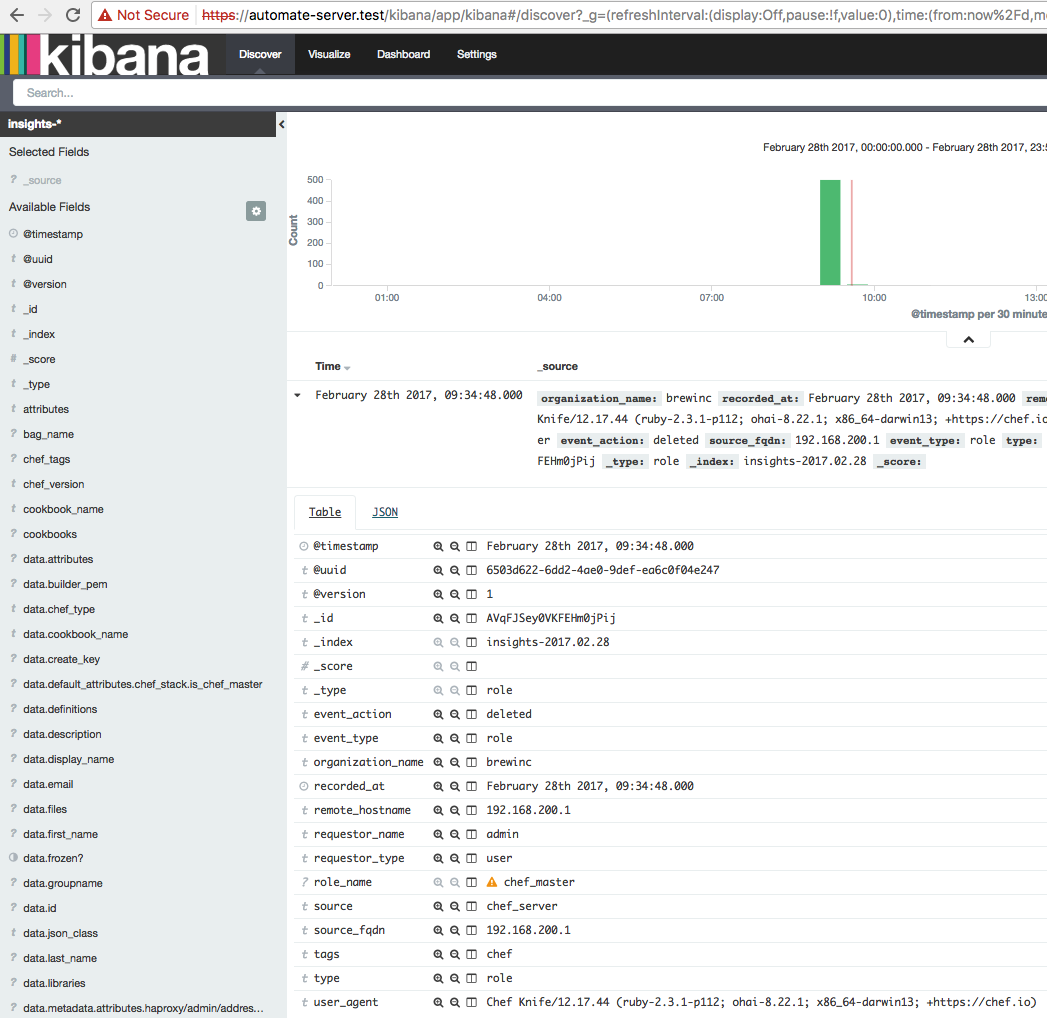
Fields that are unindexed cannot be searched. They have a greyed out magnifying glass icon next to them.
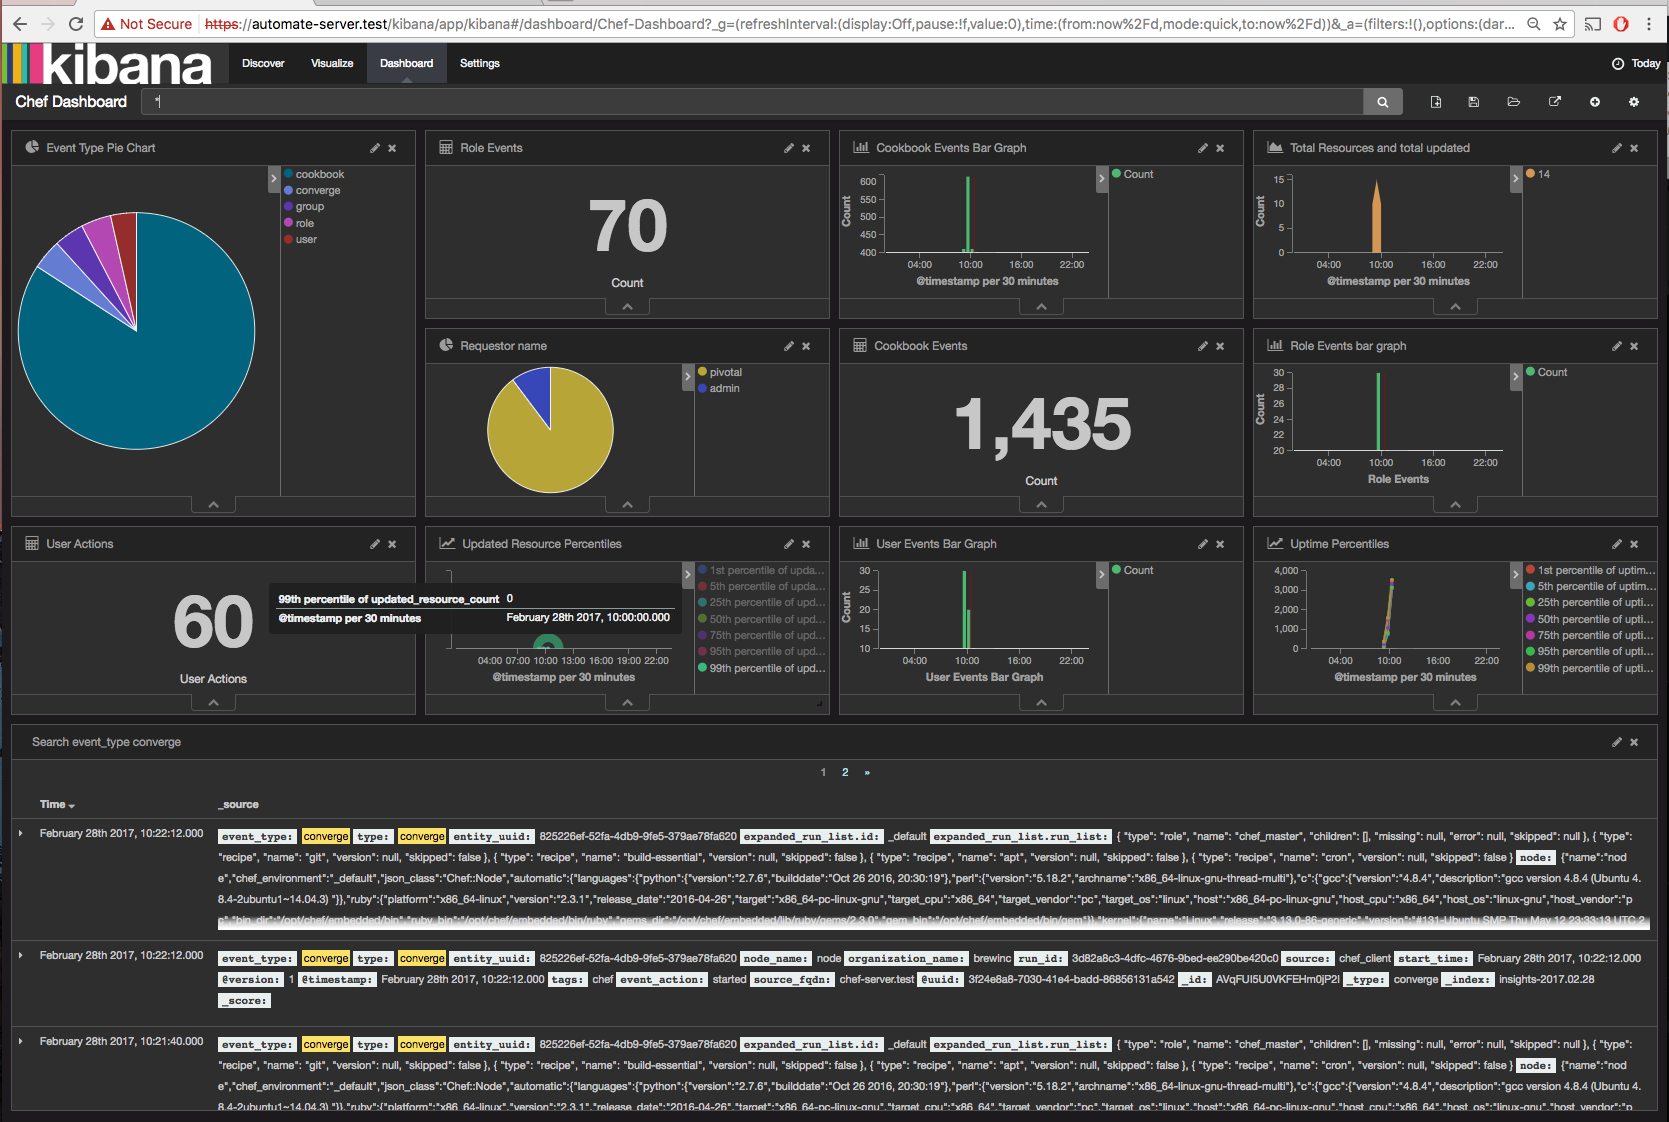
With all of that information at your disposal, it is relatively easy to create a really functional dashboard:
Kibana
Kibana is the visualization interface for the data in Elasticsearch.
For a health status overview page:
https://your-automate-server.test/kibana/status
Elasticsearch has a similar health page:
https://your-automate-server.test/elasticsearch/_cluster/health?pretty=true
To get started mining go to:
https://your-automate-server.test/kibana
When mining data, you will typically loop over this progression of steps:
- Discover
- Visualize
- Add to Dashboard
- Repeat
Discover
Click on the ‘Discover’ tab and you will get a time sorted list of events in Elasticsearch that match your search criteria and within your search time-range window.
You can modify the search criteria or begin browsing the events.
Examples of using the search:
- event_type: role AND event_action: deleted
- event_type: cookbook
- event_type: converge AND status: failure
- event_type: user AND event_action: deleted
Search syntax uses Apache Lucene
Important: In addition to the Search criteria, select the time range to filter search results:
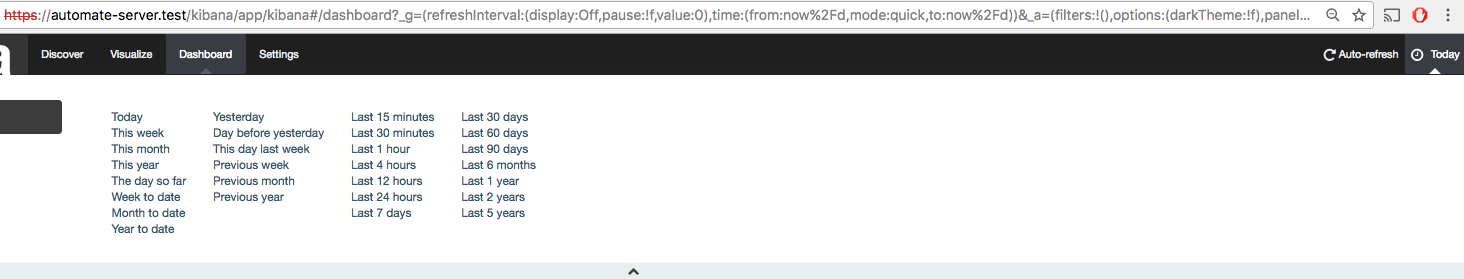
Give your search a name and Save the search.

Visualize
Visualize the search results by clicking the ‘Visualize’ tab next.
Creating a Pie Chart:
- Click ‘create new visualization’
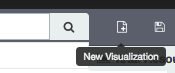
- Select a visualization type: ‘Pie chart’

- Select New or Saved search. Use the
event_type: *Search. - Select Bucket:
Split Slices - Set an aggregation field of
event_actionlike the following:
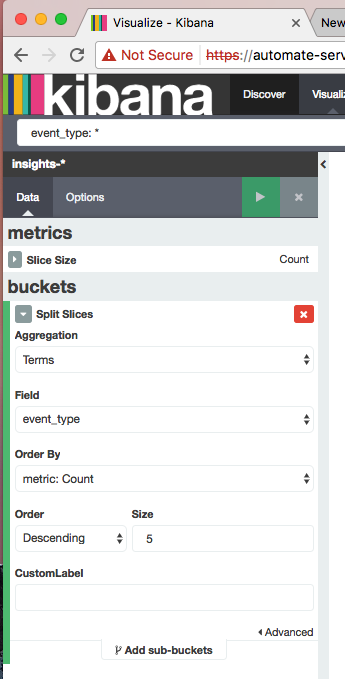
This will create a new Pie Chart visualization with each a slice/bucket for every event_action type indexed.

You can easily apply this pattern to other searches and fields as well.
Give the visualization a name and Save it.
Add to Dashboard
Once you have a Search and associated Visualization defined, it’s time to add them to a Dashboard!
Click on the ‘Dashboard’ tab then:
- Click ‘New Dashboard’
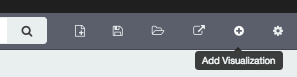
- Click ‘Add Visualization’
- Select one of your saved Vizs
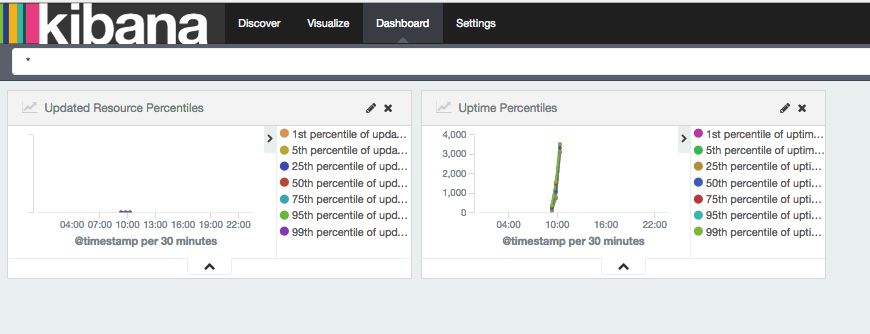
- Rinse and Repeat until you have the dashboard the way you like
- Happy Spelunking!
External Elasticsearch
Chef Automate uses Elasticsearch to store its data, and the default Chef Automate install includes a single Elasticsearch service. This is sufficient to run production work loads; however for greater data retention and perhaps performance, we recommend using a multi-node Elasticsearch cluster with replication and sharding to store and protect your data.